


Goldman Sachs Asia Equity Growth & Income - X Cap USD LU0113303043, Anlagefond
Die Daten des Fonds werden nicht mehr aktualisiertOffizielle Benennung: Goldman Sachs Asia Equity Growth & Income - X Cap USD
Investitionsgesellschaft: Goldman Sachs Asset Management B.V., Czech Branch
ISIN CP: LU0113303043
Der interaktive Graph des Fondkurses
Investitionsregion: Entwicklungsmärkte - Asien.
Loading....
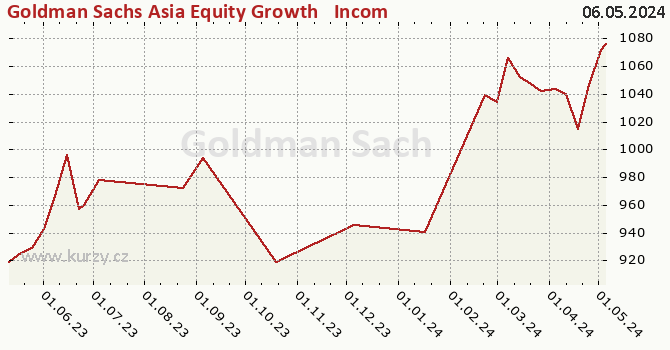
Die wöchentliche Leistungsfähigkeit des Fonds, des Kurses und Kursveränderungen
| Jahr / Woche | Datum Veröffentlichung |
NAV | TNA | Kurs | Veränderung Woche |
Veränderung Monat |
Veränderung Jahr |
| 2026 / 2 | 05.01.2026 | 1598.6100 | 2.07% | 4.26% | 41.62% | ||
| 2026 / 1 | 02.01.2026 | 1594.9400 | 2.37% | 4.02% | 38.40% | ||
| 2025 / 53 | 31.12.2025 | 1566.1300 | 0.52% | 2.15% | 36.04% | ||
| 2025 / 52 | 24.12.2025 | 1558.0900 | 1.22% | 1.24% | 34.19% | ||
| 2025 / 51 | 19.12.2025 | 1539.3400 | -0.92% | 4.12% | 34.25% | ||
| 2025 / 50 | 12.12.2025 | 1553.5700 | 1.33% | 0.66% | 32.07% | ||
| 2025 / 49 | 04.12.2025 | 1533.2300 | -0.38% | -0.44% | 29.31% | ||
| 2025 / 48 | 28.11.2025 | 1539.0200 | 4.10% | -0.71% | 34.18% | ||
| 2025 / 47 | 21.11.2025 | 1478.4400 | -4.21% | -2.13% | 26.46% | ||
| 2025 / 46 | 14.11.2025 | 1543.4000 | 0.22% | 3.32% | 32.90% |
Tägliche Werte des Kurses und Vermögens
| Datum der Veröffentlichung | NAV | TNA | Kurs |
| Weitere Tageswerte Goldman Sachs Asia Equity Growth & Income - X Cap USD | |||
| 05.01.2026 | 1598.6100 | ||
| 02.01.2026 | 1594.9400 | ||
| 31.12.2025 | 1566.1300 | ||
| 30.12.2025 | 1572.6600 | ||
| 29.12.2025 | 1569.9300 | ||
Grundangaben vom Fond
| Investitionsgesellschaft: | Goldman Sachs Asset Management B.V., Czech Branch |
| ISIN: | LU0113303043 |
| LEI: | |
| Investitionssektion: | Internet |
| Grundangaben vom Fond Goldman Sachs Asia Equity Growth & Income - X Cap USD | |
@[$z#pocet_rozbalene="5" pocet_dalsi="10" fulltext="message_title;podílový fond"]
Aktuelle Kurse des Fonds Goldman Sachs Asia Equity Growth & Income - X Cap USD, Beschreibung der Seite
Stránka nabízí přehled aktuálních kurzů otevřených podílových fondů včetně jejich procentuálních změn za poslední týden, aktuální výši čistého obchodního jmění jednotlivých podílových fondů a čisté prodeje podílových listů za poslední týden. Údaje o fondech je možno třídit podle jednotlivých typů fondů (akciový, dluhopisový apod.) nebo podle jednotlivých obhospodařovatelských investičních společností, kdy se navíc zobrazí i tabulka obsahující základní údaje o příslušné investiční společnosti. Stránka dále nabízí grafy kurzů a grafy čistého obchodního jmění jednotlivých podílových fondů, a to buď za poslední rok nebo za dobu od začátku činnosti fondu Goldman Sachs Asia Equity Growth & Income - X Cap USD.
Zeit: 1. Oktober 2026 13:38:18
| London Zeit: | 1. Oktober 2026 12:38:18 |
| New York Zeit: | 1. Oktober 2026 07:38:18 |
| Tokio Zeit: | 1. Oktober 2026 20:38:18 |